Table of Contents
Nonlinear Dynamics of Interest Rate Transmission: Equity Duration, Convexity, and the 2026 Market Split
The global financial ecosystem of 2026 is navigating a watershed moment in the relationship between monetary policy and asset valuation. After a decade defined by the persistence of the Zero Interest Rate Policy (ZIRP) and subsequent aggressive tightening cycles, the transmission mechanism of interest rates onto equity prices has revealed itself to be profoundly nonlinear. This nonlinearity is driven by the mathematical principles of duration and convexity, which dictate that the sensitivity of an asset’s price to interest rate changes is not constant but varies depending on the starting level of rates and the timing of expected cash flows. As the market enters a period of “gradual normalization” interspersed with “sticky inflation” shocks, the divergence between long-duration equities—such as Artificial Intelligence (AI) pioneers, high-growth technology firms, and green energy developers—and short-duration, value-oriented sectors has become the primary driver of institutional alpha.
Theoretical Framework: The Calculus of Equity Sensitivity
At the core of the current market volatility is the misapplication of linear models to a curved reality. Duration, traditionally a fixed-income metric, serves as a first-order approximation of an asset’s price sensitivity to yield changes. For equities, duration is essentially the weighted average time until an investor receives the present value of all future cash flows, including the terminal value. Mathematically, this is the first derivative of the price-yield function. However, as interest rates fluctuate significantly, this linear approximation fails to capture the “curvature” of the relationship, which is where convexity, the second derivative, becomes critical.
The Mechanics of Duration and Convexity
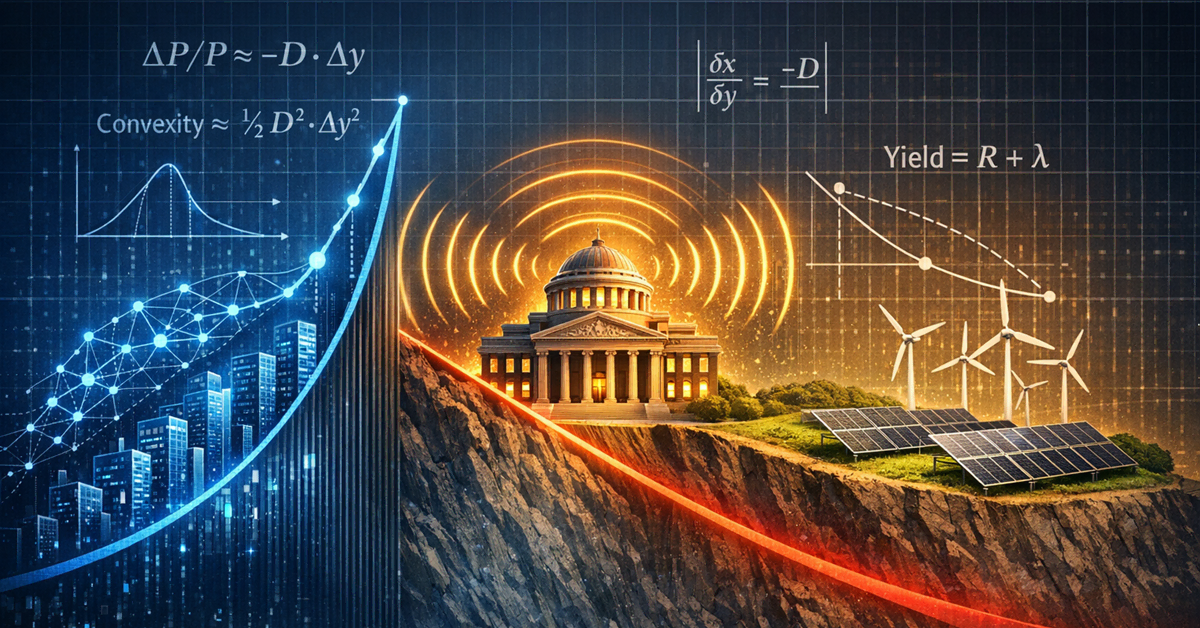
The relationship between price () and yield () can be expressed through a Taylor series expansion, where the percentage change in price is a function of modified duration () and convexity ():
In this equation, the first term represents the linear impact of duration, while the second term captures the convexity adjustment. For long-duration equities, the terminal value—the value of the firm beyond the explicit forecast period—often represents more than 80% of the total valuation. Because this terminal value is discounted over an infinite horizon, its sensitivity to the discount rate () is exponential rather than linear.
When interest rates fall, the duration of both assets and liabilities increases. However, negative convexity in certain portfolios can imply that the duration gap becomes larger as rates decline, creating a feedback loop between investor hedging and market prices. Conversely, as interest rates increase, the relative importance of convexity decreases, meaning price declines for long-term securities are smaller than a simple duration model would predict, provided the asset exhibits positive convexity.
Equity Duration and the Terminal Value Partition
Adapting bond duration to equities requires partitioning the valuation into a finite forecasting horizon and an infinite terminal expression. Implied equity duration () can be defined as:
Where is the forecast horizon, are the cash flows, is the expected return, and is the present value of the terminal value. This formula highlights why AI and green energy firms, which project significant cash flow growth ten or twenty years into the future, possess “long duration”. Their valuations are fundamentally anchored in the distant future, making them highly susceptible to changes in the long-term risk-free rate and the equity risk premium.
| Sensitivity Metric | Mathematical Definition | Financial Implication |
| Modified Duration | Percentage price change for 1% change in yield. | |
| Convexity | Measures the rate of change of duration. | |
| Terminal Value | The dominant component of long-duration equity value. | |
| Duration Gap | Sensitivity of net net worth to interest rate shifts. |
The AI Supercycle: Duration Extension and Hyperscaler Debt
The 2023-2025 period was characterized by an “AI boom” that reshaped global capital expenditure (Capex) profiles. By 2026, this boom has evolved into a structural “supercycle,” driving above-trend earnings growth of 13-15% for the S&P 500’s tech leaders. However, the duration of these firms is not static; it is being extended by the “unprecedented investment” in infrastructure that delays the realization of steady-state free cash flow.
Performance Divergence and Concentration
A custom basket of 46 AI stocks within the S&P 500 demonstrated the power of this supercycle by growing aggregate net income at 30% per year from 2023 to 2025, compared to a mere 3% for the non-AI cohort. This divergence is the result of a “winner-takes-all” dynamic where a handful of “hyperscalers”—Amazon, Google, Meta, Microsoft, and Oracle—dominate both the market capitalization and the Capex narrative.
The concentration of the U.S. equity market has reached historic levels, with the top five tech firms holding a collective value of $17.6 trillion, surpassing the combined GDP of several major global economies. This concentration increases the market’s overall duration, making the entire S&P 500 more sensitive to interest rate paths than at any point in the last several decades.
The Evolution of AI Financing
As AI adoption moves from proof-of-concept to large-scale deployment, a significant trend for 2026 is the increasing reliance of hyperscalers on debt financing to fund their massive Capex requirements. In 2025 alone, these five firms issued approximately $90 billion in credit. While these companies currently possess robust cash flows and low leverage, the rapid ascent of AI-related debt could pressure credit metrics and widen spreads as the cycle matures.
This “Capex-to-debt” transition has profound implications for market duration. When these firms fund growth through equity, their duration is tied to the discount rate of future earnings. When they shift to debt, they introduce interest rate risk directly onto their balance sheets, creating a multi-layered sensitivity where both the equity valuation and the cost of debt service are nonlinearly linked to the Federal Reserve’s policy path.
| Investment Theme (2026) | Projected Infrastructure Spend | Key Economic Driver |
| AI Infrastructure | >$700 Billion | Compute demand exceeding supply. |
| Data Centers | $370B Annualized by Q2 | Expansion of LLMs and generative AI. |
| Power Infrastructure | $2.4 Trillion by 2030 | AI-driven energy consumption surge. |
| Sustainable Digital Infra | N/A (Emerging) | Collision of AI demand and grid limits. |
Green Energy: The IRR Vulnerability of Long-Duration Projects
The renewable energy sector represents the “other side” of long duration. Unlike AI, where growth is driven by technological disruption and software margins, green energy projects—solar, wind, and storage—are capital-intensive infrastructure plays with returns fixed over decades. This makes their Internal Rate of Return (IRR) and Net Present Value (NPV) uniquely sensitive to the normalization of interest rates.
WACC Spikes and the NPV Cliff
For a typical solar PV or wind project, the vast majority of costs are incurred upfront, while the savings or revenues are realized over a 15-to-25-year horizon. A sensitivity analysis conducted in 2025 revealed that as interest rates rose, the Weighted Average Cost of Capital (WACC) for these projects increased from roughly 9% in the pre-inflationary period to over 14% in some regions.
The application of random interest rate shocks to three major alternative energy projects (solar, woodchip boiler, heat pump) showed that the probability of a negative NPV—meaning the project would fail to return its investment expenditure—exceeded 55%. This explains the “NPV cliff” that many green energy developers have faced as central banks moved from ZIRP to a “sustained high” rate path.
The 2026 Slowdown in Renewables Additions
For the first time in history, global solar additions are expected to decline year-over-year in 2026. This contraction is primarily driven by a sharp decline in China, where annual additions are forecast to fall from 300 GW in 2025 to 200 GW in 2026. While this signals the end of uninterrupted growth, it reflects a pragmatic pivot by developers to focus on capital efficiency and “solar-plus-storage” to serve the skyrocketing demand from AI data centers.
The “politics of energy” has also emerged as a critical factor. As electricity bills rise to fund grid modernizations, voters in many regions are reassessing their support for subsidized transitions, leading to a “fracturing” of policies that once provided a stable floor for green energy valuations.
| Energy Sector Metrics | 2024-2025 Status | 2026 Forecast/Reality |
| Global Solar Additions | Peak growth (China-led) | <10% YoY Decline. |
| Storage Capacity (US) | 37.4 GW (Oct 2025) | +19 GW Under Construction. |
| Project NPV Risk | Moderate | >55% Probability of Negative NPV. |
| WACC for Renewables | ~9.1% (2019 avg) | ~11-14% Range. |
The 2026 Market Split: Rotation and Reflation
The “everything rally” of late 2025, which saw gold, emerging markets, and the S&P 500 all reach new highs, has given way to an intense sector rotation in early 2026. This rotation is characterized by a “market split” where value-oriented sectors—traditionally possessing shorter duration—have significantly outperformed the tech-heavy growth sectors.
Value Outperformance and Overbought Extremes
Since the beginning of 2026, sectors such as Energy (+21% YTD), Materials (+17% YTD), Staples (+15% YTD), and Industrials (+12% YTD) have vastly outperformed the broader market. This shift represents a “reflation trade” narrative, where investors seek protection against sticky inflation and take advantage of the “hard assets” rally.
However, this rotation has pushed many of these sectors into extreme overbought territory. By February 2026, Basic Materials (XLB), Staples (XLP), and Industrials (XLI) were all trading more than 3 standard deviations above their 50-day moving averages. Conversely, the Technology sector (XLK) has been the “poster child” of the selloff, testing critical support levels as its long-duration profile becomes a liability in an environment of rising yield curve term premia.
The Role of Tariffs and Policy Uncertainty
The U.S. effective tariff rate rose dramatically in 2025, reaching 13.5% by year-end—a level not seen in a century. These tariffs act as a “pro-cyclical” dynamic that challenges the “lower for longer” rate narrative. For long-duration equities, tariffs are a double-edged sword: they potentially boost domestic industrials (short-to-medium duration) while simultaneously increasing the costs for tech hardware and green energy inputs, thereby compressing margins and extending the time until these firms reach positive free cash flow.
Impact on Investor Decision-Making: Tactical and Strategic Shifts
The realization that interest rate transmission is nonlinear has forced institutional investors to overhaul their portfolio construction tools. The “60/40” portfolio is being augmented with “alternative credit,” “options-based strategies,” and “diversified duration” to mitigate the shocks of the 2026 rate environment.
The Shift Toward Quality and Active Selection
In light of rising idiosyncratic risk—where credits once seen as safe are now put at risk by AI-related disruption—investors are emphasizing security selection and “quality”. This involves a move away from passive indexing toward active approaches that can curb volatility and manage the high dispersion within the AI theme.
For example, while the “Magnificent 7” was once viewed as a defensive bunker, investors are now questioning if these mega-caps can truly curb losses in a sharp downturn given their elevated valuations and concentrated duration risk.
Hedging and Options-Based ETFs
A significant trend for 2026 is the explosive growth of “options-based ETFs,” which provide income and defined outcomes in volatile markets. Strategies that use call option overlays, such as the Goldman Sachs S&P 500 Premium Income ETF (GPIX), or “buffer ETFs” that protect against initial losses, such as the Goldman Sachs U.S. Large Cap Buffer 3 ETF (GBXC), have become mainstream.
These funds allow investors to maintain exposure to the growth potential of long-duration tech while using the “income as the outcome” to offset the valuation erosions caused by higher discount rates. By the end of 2025, these strategies were already providing distribution rates in the 8-12% range, attracting significant flows from retirees and risk-averse institutions.
Strategic Hedging of Currency and Duration Gaps
Institutional investors, particularly insurers, are grappling with “negative balance sheet convexity”. As long-term rates fall, the duration of their liabilities rises faster than the duration of their assets, widening the duration gap nonlinearly. To manage this, institutions are prioritizing “diversified duration exposures” and “strategic curve positioning” rather than simply betting on the direction of rates.
In the currency markets, there is a strategic move to increase the USD hedge ratio for non-U.S. investors. This shift is based on the view that U.S. asset valuations are “extreme” and that a less supportive policy backdrop for the dollar is emerging as global growth and inflation dynamics diverge.
| Investor Action | Strategy Implementation | Rationale for 2026 |
| Decrease Downside Hedge | Reduce underweight to equity options | Downside risks viewed as below average; mindful of short-term hedge losses. |
| Overweight Alternative Credit | Best ideas over IG credit | IG spreads are tight; high AI issuance poses risk to corporate spreads. |
| Strategic Currency Adjust | Increase USD hedge ratio | High USD valuations and policy crosscurrents. |
| Duration Re-benchmarking | Focus on 4-to-7 year durations | Avoid long-end volatility while capturing yield. |
Macroeconomic Polarities: The US vs. the Multipolar World
The transmission of rates is further complicated by the “multipolar” nature of the 2026 global economy. While the U.S. remains the epicenter of AI-driven growth, other regions are charting their own courses, creating opportunities for “central bank divergence” plays.
Sanaenomics and the Japan Reform
Japan has emerged as a key beneficiary of this multipolar shift. The economic policies of Prime Minister Sanae Takaichi, combined with ongoing corporate reforms, have propelled Japanese equities in 2026. Japanese firms are focusing on unlocking excess cash and increasing capital investment, providing a pro-cyclical tailwind that contrasts with the “sticky inflation” concerns in the U.S..
Emerging Markets Resilience
Emerging Market (EM) equities are positioned for robust performance in 2026, aided by lower local interest rates and attractive valuations. On a forward P/E basis, EM equities traded at a 40% discount to U.S. equities by late 2025, well below their long-term average. For investors, this represents a way to access growth without the extreme duration-sensitivity inherent in the U.S. “Magnificent 7”.
The Persistence of the Credit Cycle and AI Debt
As 2026 progresses, the market is closely monitoring “AI capex as a counterbalance” to real economy weaknesses, such as slowing consumer spending. There is a lingering fragility: if AI investments fail to generate the promised returns, or if labor market weakness accelerates, the massive debt taken on by hyperscalers could trigger a “hard landing”.
Analysts view the current U.S. investment-grade credit market as being in a “mid-cycle” backdrop, but they warn that the sheer scale of AI-related debt ($90B from five firms in 2025) requires constant surveillance. Recent credit events, such as fraud allegations or idiosyncratic bankruptcies, are currently seen as isolated, but they highlight the rising risks as the credit cycle ages and the “nature of the economy changes”.
Quantitative Analysis of Rate Paths on AI Valuations
The reaction of AI and tech stocks to different rate paths in 2026 can be categorized into two primary scenarios based on the Federal Reserve’s stance on inflation and growth.
Scenario A: “Immaculate Disinflation” and Gradual Normalization
In this scenario, inflation falls faster than expected, allowing the Fed to deliver gradual rate cuts toward a terminal level of roughly 3.5-4.0%. This would provide a “major boost” to long-duration equities by lowering the discount factor for terminal values and reducing the cost of AI infrastructure financing. In this environment, the “winner-takes-all” dynamic continues, and market concentration reaches new highs as Capex resiliency remains unchallenged.
Scenario B: “Sustained High” or “Sticky Inflation”
If inflation remains above target—driven by tariffs, labor market tightness, and high government deficits—central banks may be forced to hold rates at “simultaneous highs” above pre-COVID benchmarks. This scenario is “slightly negative for bonds” and puts immense pressure on risky assets that previously benefited from cheap liquidity. In this path, the AI sector faces episodes of “temporary retracement” and high volatility as investors begin to question the sustainability of the Capex boom.
Conclusion: Navigating the Nonlinear Future
The “new normal” of 2026 is defined not by the level of interest rates, but by the volatility of the rate path and the nonlinear ways in which it transmits to asset prices. Long-duration equities in the AI and tech sectors remain the primary engines of growth, but their valuations are now hostage to the mathematical curvature of the yield curve.
For green energy, the 2026 “slowdown” is a sobering reminder of the capital intensity of the energy transition. The success of this sector now depends on “sustainable digital infrastructure”—a synergistic relationship where AI demand provides the economic justification for the expensive, long-duration grids of the future.
For the institutional investor, the mandate is clear: duration must be managed as a risk, not just a byproduct of equity selection. The move toward alternative credit, buffer ETFs, and regional diversification into markets like Japan and EMs reflects a maturation of portfolio construction in a world where the Taylor series expansion is more relevant than the simple discount model. As the “market split” intensifies, those who understand the second-order effects of yield changes—convexity—will be best positioned to navigate the complexities of the late-2020s economy.