Table of Contents
Executive Summary
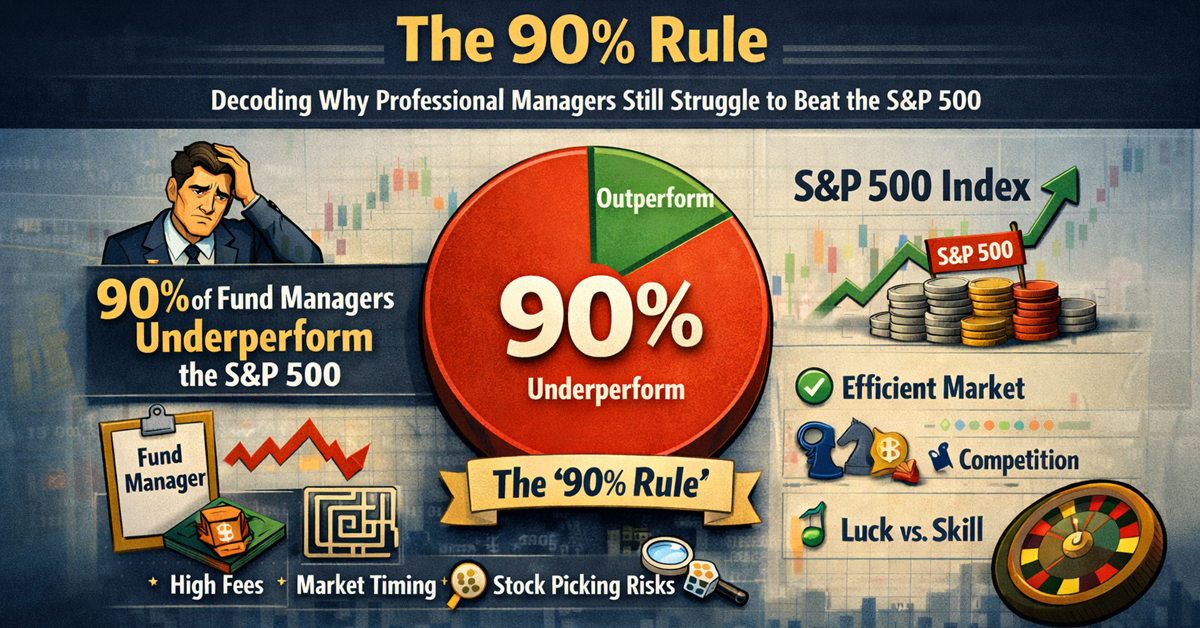
Professional fund managers are often presumed to have the skill and resources to outperform market indices. Yet decades of evidence reveal a persistent truth: the vast majority of active investment managers underperform broad market benchmarks like the S&P 500. This phenomenon – colloquially referred to here as “the 90% rule” – reflects findings that roughly 80–90% of active equity fund managers fail to beat the index over long time horizons. This whitepaper examines why beating a passive index is so challenging even for experts, drawing on historical performance data, financial theories, and behavioral finance insights.
We begin by defining the 90% rule in context and reviewing 50 years of data on passive vs. active investing. The historical analysis shows that since the 1970s, passive index-based strategies have consistently outperformed the average active fund net of fees, with underperformance rates climbing higher the longer the time frame considered. We then explore the theoretical framework behind this underperformance: the Efficient Market Hypothesis (EMH) suggests market prices already reflect available information, Modern Portfolio Theory (MPT) implies that broad diversification (akin to an index) is optimal for risk-adjusted returns, and behavioral biases (overconfidence, herding, loss aversion) can undermine manager decision-making. These concepts, backed by empirical studies, help explain why so many professionals lag the index.
Finally, we provide practical investment strategies for retail investors who want to harness the advantages of passive investing. These include systematic approaches like dollar-cost averaging and diversified index fund portfolio models, as well as techniques such as tax-loss harvesting and factor-based investing to potentially enhance returns or reduce taxes without deviating from a disciplined, low-cost strategy.
Introduction
In the world of investing, the S&P 500 index has long been a standard benchmark for U.S. stock market performance. Beating this benchmark is notoriously difficult – so difficult that most professional money managers fail to do so consistently. This reality is encapsulated in what we term “the 90% rule”: the observation that roughly 9 out of 10 actively managed investment funds underperform their benchmark (often the S&P 500 or a similar index) over extended periods. In other words, if one were to pick an active mutual fund or hedge fund at random, the odds are high that it will deliver lower returns than a low-cost index fund tracking the S&P 500.
This counterintuitive outcome – experts with vast research budgets and trading acumen lagging a simple passive index – has been documented repeatedly. S&P Dow Jones Indices’ ongoing SPIVA reports (“S&P Indices Versus Active”) show a consistent pattern: the majority of active funds lag their benchmarks in most asset classes, and the fraction that lag grows over time. This is not a new phenomenon; it has persisted through bull and bear markets, low-rate and high-rate environments, and across different market conditions.
Why do professional managers struggle to beat a market index? This whitepaper delves into the underlying causes. We will review historical performance data comparing active and passive approaches, then discuss key economic theories and behavioral factors that shed light on active managers’ challenges. Concepts from the Efficient Market Hypothesis (EMH) and Modern Portfolio Theory (MPT) help explain why consistent outperformance is inherently difficult. At the same time, real-world frictions – including management fees, transaction costs, and human biases like overconfidence or aversion to losses – further erode active returns.
For retail investors, the implications are profound. If most experts fail to beat the market, an individual investor is well served by approaches that accept market returns (via passive investing) rather than chasing elusive “alpha” (excess returns). In the later sections, we outline passive investment strategies suited to individuals: straightforward techniques like regular dollar-cost averaging, diversified index fund allocations, and tax-efficient practices. We also discuss factor-based investing – a way to tilt a passive portfolio toward sources of potential long-term outperformance (such as value or small-cap stocks) without engaging in stock-picking. Overall, this paper aims to decode the reasons behind active managers’ struggles and to guide investors on how to capitalize on the power of passive strategies.
Key Concepts
The “90% Rule” – Active Manager Underperformance: In the context of this discussion, the 90% rule refers to the striking statistic that roughly 90% of active fund managers underperform their benchmark index (like the S&P 500) over meaningful periods (typically a decade or longer). This is not a hard-and-fast law, but rather a rule of thumb suggested by numerous studies. For instance, a global S&P analysis found about 90% of equity fund managers lagged their index over a 10-year horizon. This concept highlights the base rate of failure among active funds and underscores why passive indexing has gained traction.
Active vs. Passive Investing: Active management involves making conscious deviations from market indices – picking stocks the manager believes will outperform, timing when to be in or out of certain sectors, and generally trying to beat the market. Passive investing, by contrast, aims to match the market by holding a broad, representative portfolio (such as all 500 stocks in the S&P 500, weighted by their market size). Passive funds do not try to forecast winners; they simply replicate an index’s composition. As a result, passive strategies have lower operating costs (no need for expensive research teams or frequent trading) and very low turnover. The S&P 500 index itself is often viewed as a proxy for “the market” and is cap-weighted, meaning each stock is held in proportion to its market capitalization. An S&P 500 index fund, therefore, provides instant diversification across hundreds of large companies and essentially delivers the market’s return at minimal cost.
Benchmark and Alpha: A few technical terms are useful. A benchmark is a standard against which performance is measured; for U.S. large-cap stock funds, the S&P 500 is a common benchmark. Alpha is the excess return of a portfolio above its benchmark, after adjusting for risk. Active managers strive to generate positive alpha through skillful stock selection or market timing. However, the 90% rule implies that negative alpha is far more common – most managers subtract value net of fees, delivering less than benchmark returns. In practice, the average mutual fund alpha has often been slightly negative, roughly corresponding to the fund’s expenses and transaction costs.
SPIVA and Survivorship Bias: Much of what we know about active vs. passive performance comes from comprehensive data analyses. S&P’s SPIVA Scorecards, published semiannually since 2002, compare actively managed funds to appropriate index benchmarks across various categories (large-cap, mid-cap, international, fixed income, etc.). This high attrition is often due to underperformance. By cleaning the data for such biases, SPIVA provides robust evidence that active management’s underperformance is even worse than raw averages might show, since many of the worst performers are no longer around to be counted.
In summary, the key concept of the 90% rule is that active investing is a very challenging zero-sum game (actually negative-sum after costs), and as a result, a passive index approach tends to come out ahead for most participants. Next, we turn to the theoretical underpinnings of why this is the case.
Theoretical Framework
Efficient Market Hypothesis (EMH)
One classic explanation for active managers’ difficulties is the Efficient Market Hypothesis (EMH). EMH, articulated in the late 1960s by Eugene Fama and others, posits that financial markets rapidly incorporate all available information into security prices. In its “semi-strong” form, EMH holds that any publicly available information is already reflected in stock prices, so only new, unexpected information moves the market. If markets are highly efficient, it becomes extremely hard to consistently find undervalued stocks or predict price moves – any potential bargains or mispricings are quickly eliminated by the collective actions of many traders.
Under EMH, an active manager would need either inside information (violating the strong form of EMH) or some unique analytical edge consistently to beat the market. In reality, with thousands of smart, well-equipped participants all analyzing the same data, sustained outperformance is unlikely. This doesn’t mean no one ever beats the market (some do, by luck or skill in short periods), but EMH implies that persistent skill-based outperformance is rare. The pattern of mutual fund returns aligns with this: studies have found that the few funds which do outperform in one period often regress to the mean in subsequent periods, suggesting luck more than skill. Even when slight persistence is detected, it’s often explained by factor exposures or just the laws of probability (a tiny fraction will beat the odds by chance). As an S&P research paper put it, “extensive empirical data support the view that we should expect most active managers to underperform”. In essence, if markets are efficient, the average manager’s chance of beating the market after fees is minimal – consistent with the 90% rule.
Modern Portfolio Theory (MPT) and the Market Portfolio
Modern Portfolio Theory (MPT) provides another perspective on why passive investing makes sense. Pioneered by Harry Markowitz (Nobel laureate) in 1952 and later extended by William Sharpe (CAPM) and others, MPT teaches that investors should hold efficient portfolios that maximize return for a given level of risk (or equivalently, minimize risk for a target return). One core implication of MPT (via the Capital Asset Pricing Model, CAPM) is that the market portfolio – a portfolio containing all assets weighted by their market values – lies on the efficient frontier. In a CAPM world, the market portfolio (approximated by a broad index like the S&P 500 for stocks) has the highest Sharpe ratio (risk-adjusted return) of any stock portfolio.
If that is true, an active manager who deviates from the market by overweighting or underweighting certain stocks is unlikely to improve the risk-adjusted performance unless they have genuinely superior insight. In fact, Sharpe’s “Arithmetic of Active Management” elegantly proves that, before costs, the average active investor earns the market return, and after costs, the average active dollar must lag the passive benchmark. This is a powerful theoretical argument that mirrors the empirical reality.
In summary, MPT and related theory suggest that holding a low-cost index fund (a proxy for the market) is an optimal strategy for most, and that active bets are unlikely to pay off on average. The few active managers who do succeed must do so at the expense of others, and identifying them in advance is exceedingly difficult. Moreover, as more investors embrace passive strategies, markets may become even harder to beat (any easy inefficiencies get arbitraged away quickly). While EMH and MPT provide a rational, information- and risk-based explanation for active underperformance, there are also behavioral factors at play, which we explore next.
Behavioral Finance Factors: Overconfidence, Herding, and Loss Aversion
Real-world investment decisions are not always perfectly rational. Behavioral finance examines how cognitive biases and emotions can lead to suboptimal decisions. Such biases can affect professional managers just as they affect individual investors, contributing to underperformance. Three relevant behavioral tendencies are overconfidence, herding, and loss aversion:
- Overconfidence Bias: Overconfidence is the tendency for people to overestimate their own skills, knowledge, or ability to control outcomes. In the context of fund management, overconfident managers might trade more frequently or take concentrated bets, believing strongly in their forecasts. This often leads to excessive trading and higher turnover, which in turn incurs greater costs and potential timing errors. Studies have shown that higher trading activity tends to correlate with lower net returns, largely due to transaction costs and mistakes – for example, individual investors who traded most actively significantly underperformed those who traded less. Professional managers, armed with advanced research, can also fall prey to overconfidence by assuming their analyses are superior. They may ignore the possibility that a stock’s prospects are already fully reflected in the price. This bias can result in underestimating risks or holding onto losing positions too long, hurting performance. Essentially, overconfidence can erode the modest edge a manager might have, by prompting actions that are too aggressive or frequent. A cool-headed passive strategy, in contrast, doesn’t try to outsmart the market on every twist and turn – thereby avoiding this pitfall.
- Herding Behavior: Herding occurs when investors collectively gravitate toward the same assets or strategies, often due to peer influence, fear of missing out, or career risk considerations. Fund managers, even at the professional level, can exhibit herding – for instance, many funds might crowd into popular growth stocks during a boom, or all dump a certain sector at the same time. This behavior can be driven by career concerns: an active manager risks being fired for underperforming peers, so there is a temptation to stay close to the pack (the “safe” choice is to hold similar positions as everyone else, which sometimes leads to closet indexing with a high fee). Unfortunately, herding can cause price distortions (overvaluation of trendy stocks) and poor outcomes when the crowd is wrong. Empirical research indicates that funds which simply follow the crowd tend to underperform those that go against it. One study found that the top-decile of “herding” funds (those whose trades most closely imitated other institutions) underperformed the bottom-decile of more contrarian funds by about 2.3% per year. This suggests that managers who exhibit independent thinking (and break from the herd when warranted) achieve better results, whereas herding behavior – perhaps a byproduct of lack of original insight or fear of deviating – leads to mediocre performance. In aggregate, if many managers herd into the same crowded trades, none of them gain an edge over each other, and they all incur costs that cause them collectively to lag the index.
- Loss Aversion and the Disposition Effect: Loss aversion is a cornerstone of behavioral economics (from Kahneman and Tversky’s prospect theory): it refers to people’s tendency to strongly prefer avoiding losses than acquiring equivalent gains. A well-known manifestation of this in investing is the disposition effect, where investors hold onto losing investments too long (hoping to “get back to even”) and sell winning investments too early (locking in gains due to fear those gains might vanish). Professional fund managers are not immune to this bias. If a manager is reluctant to admit a mistake, they might keep a poorly performing stock in the portfolio in the hope of a rebound, rather than rotating into a more promising investment. This can lead to opportunity costs and further underperformance. Research confirms that even mutual fund managers exhibit the disposition effect, though perhaps to a lesser degree than retail investors. Notably, a study by Singal and Xu analyzed over 2,300 active mutual funds and found that those funds with strong disposition tendencies underperformed their peers by about 4–6% per year. In essence, clinging to losers (and potentially doubling down on them) or shying away from rebalancing the portfolio can drag down returns substantially. Loss aversion might also make a manager too cautious – e.g. sitting on excessive cash after a loss, which in a rising market causes underperformance relative to a fully invested index.
In summary, even if a manager possesses skill, human biases can interfere with the effective execution of an active strategy. Overconfidence can lead to overtrading; herding can lead to overcrowded, unoriginal portfolios; and loss aversion can impede rational decision-making on when to cut losses or let winners run. These behavioral factors, combined with the structural disadvantages (like higher fees and an efficient market), stack the odds against active funds.
Empirical data backs this up: the distribution of fund returns shows not only that most funds underperform, but even those that beat the index often do so by slim margins, whereas the laggards underperform by larger margins – consistent with the notion that mistakes and costs have an asymmetrically negative impact. As a result, passive indexing avoids many of these pitfalls by design: it does not rely on forecast skill (avoiding overconfidence), it does not depart from the market consensus (so no herding penalty, it is the herd in effect), and it enforces discipline (no emotional trading based on wins or losses).
Next, we examine the historical track record in detail to see how passive strategies have fared versus active management across the past several decades.
Historical Analysis: 50 Years of Passive vs. Active Performance
Early Evidence (1960s–1980s): The question of whether professional fund managers add value beyond the market was first rigorously studied in the 1960s. A landmark study by Michael Jensen in 1968 evaluated 115 mutual funds from 1945 to 1964, developing what is now known as Jensen’s alpha to measure risk-adjusted excess returns. Jensen’s findings were sobering: on average, the mutual funds did not earn returns higher than what one would expect by chance given their risks, and in fact slightly underperformed after accounting for fees. In Jensen’s words, the funds were “not quite successful enough in their trading activities to recoup even their brokerage expenses.” This result was an early indication that active management might not justify its costs.
The 1970s saw the birth of the index fund. In 1975, John Bogle at Vanguard launched the first retail index mutual fund (tracking the S&P 500). At the time, the idea of not trying to beat the market but simply mirroring it was ridiculed by many on Wall Street (it was called “un-American” to settle for average). However, as years passed, the “average” turned out to be better than most professionals achieved. During the 1980s and early 1990s, researchers continued to amass evidence. For example, Burton Malkiel examined equity mutual fund returns in the 1970s and 1980s and found that once survivorship bias was accounted for, funds had significantly underperformed indices. Malkiel also noted that any performance persistence (funds repeatedly outperforming) observed in earlier decades had largely vanished by the 1980s – consistent with an increasingly efficient market where arbitrage opportunities get competed away.
By the mid-1990s, the weight of evidence led to a famous statement by Nobel laureate William Sharpe (mentioned earlier): “The average active manager must underperform the average passive manager after costs.” In 1997, Mark Carhart published a influential study showing that the few mutual funds with superior past records could be explained by factor exposures like momentum, and that after adjusting for these common factors, the average fund had a slightly negative alpha (approximately equal to −1%/year, the average expense ratio at the time). This implied that whatever gross skill fund managers might have had, it was being consumed by fees and trading costs.
Rise of SPIVA and 21st Century Data: In 2002, S&P Dow Jones Indices began publishing the SPIVA Scorecards, adding a new level of transparency. These reports compare thousands of funds against appropriate benchmarks with a rigorously data-driven approach. The results over the next two decades were remarkably consistent. Year after year, a majority of active funds underperform. There are occasional short-term periods where active managers collectively have better odds (for example, in certain market downturns or in less-followed segments like mid-caps for a year or two), but those are exceptions. The long-term outcomes are unequivocal. To illustrate:
- Over the past 20 years (through 2024), across almost all equity categories, over 90% of actively managed funds have underperformed their benchmark index. This holds for large-cap U.S. stocks and extends similarly to international equities and many fixed income categories.
- The longer the time horizon, the worse the average active performance. At the 1-year mark, SPIVA reports often show a sizeable minority of funds beating the index (in some categories even ~40% might outperform in a given single year). But extend the horizon to 5 years, 10 years, 15 years, and the outperformers dwindle. For example, after 10 years, typically 85–95% of funds lag the index, and by 15 years it’s nearly universal that the index wins.
- Magnitude of underperformance: Not only do most funds fail to beat the index, but the average shortfall can be meaningful over time. A difference of even 1% per year in returns compounds significantly. Paul Merriman, citing SPIVA data, gives an example: over 10 years, the S&P 500 index compounded at 8.2% annually while the average large-cap active fund managed only 7.3% – a 0.9% per year gap. Such differences can translate into millions less in an investor’s ending wealth due to compounding.
- Survivorship and turnover: As noted, a large fraction of funds do not survive long term. Often the worst performers are closed or merged. Over 20-year spans, only about one-third of equity funds survive; in certain categories like large-cap growth, as few as ~26% of the starting funds are still around 20 years later. This attrition is part of why naive analyses (that ignore dead funds) understated how poor active management can be. SPIVA’s inclusion of dead funds gives a fuller picture: many funds disappear because they did poorly. This reinforces the conclusion that the deck is stacked against consistently beating the market.
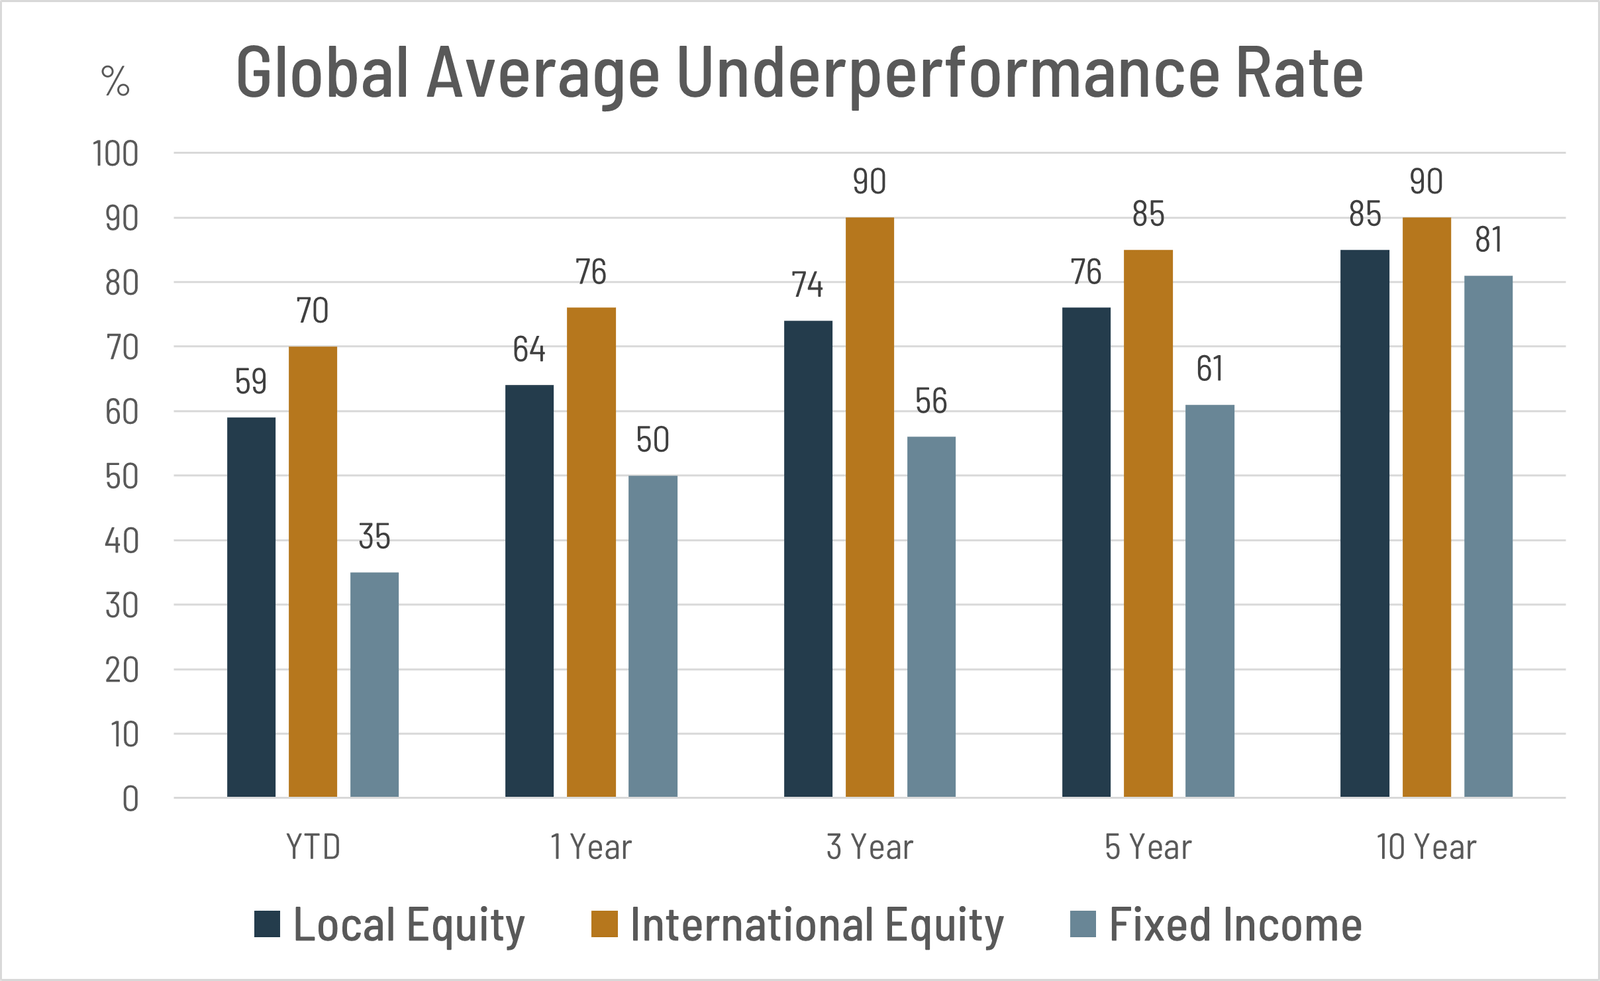
Figure: Percentage of active fund managers underperforming their benchmarks across various time horizons, illustrating the “90% rule.” In a global sample, around 90% of equity fund managers underperformed their index over a 10-year period, and even over 5 years the underperformance rate was about 85%. These data (from S&P Global’s SPIVA scorecard) highlight that the longer the timeframe, the higher the likelihood of underperformance for active funds.
It’s worth noting that passive investing’s success has led to massive growth in index funds. Fifty years ago (early 1970s), index funds didn’t exist – 100% of mutual funds were active. Today, index mutual funds and ETFs command a huge portion of the market. By the end of 2023, for the first time in history, the assets in U.S. passive equity funds exceeded those in active equity funds. This seismic shift has been driven by the recognition that paying high fees for active management often does not pay off. Investors have voted with their dollars, pouring money into low-cost index funds. Over the last decade, hundreds of billions have flowed out of active funds and into passive vehicles.
Counterpoints and Market Cycles: While the overall trend strongly favors passive, it’s important to acknowledge that active management can have short-lived victories. For example, in certain volatile markets or niche asset classes, a higher fraction of active funds might outperform for a year or two. In 2022, a brutal year for both stocks and bonds, a slightly larger minority of active stock pickers beat the S&P 500 (as falling markets sometimes give good stock-pickers a chance to shine by holding cash or defensive stocks). However, these periods are often followed by reversions. The long-term data smooths out any single year’s peculiarities. Additionally, some active managers do consistently beat the market (Warren Buffett being a famous example), but they are exceedingly rare – and often they’re hard to identify in advance. By the time a fund has a 20-year winning record, it’s often closed to new investors or its edge may diminish. The practical challenge for an individual is that the average outcome heavily favors passive, and picking an outlier in advance is guesswork.
In summary, the historical record from the mid-20th century to today provides overwhelming support for the superiority of passive index investing for the average investor. Passive strategies have delivered market returns reliably, while active strategies have tended, on average, to lag by roughly the size of their fees (or worse). This has held true across different eras of market regulation, different geopolitical climates, and varying interest rate regimes. The consistency of these results reinforces the theoretical arguments made earlier: markets are hard to beat, costs and mistakes add up, and thus most active efforts are in vain.
Having established the why and how often of active underperformance, the final section of this whitepaper turns to a constructive question: given this information, what should a prudent retail investor do? We will outline several passive investment strategies and best practices that can help investors harness the advantages of indexing, manage risks, and even incrementally improve outcomes through smart tactics – all while avoiding the common traps that active managers fall into.
Investment Strategies for Retail Investors
For a retail investor convinced by the evidence in favor of passive investing, the logical next step is implementation. It’s not enough to know that index funds tend to outperform – one must also invest correctly in them over the long term. Below we discuss several passive investment strategies and principles tailored to individual investors. These approaches aim to maximize the benefits of passive investing (simplicity, low costs, broad diversification) while addressing practical considerations like market volatility and taxes.
1. Dollar-Cost Averaging (DCA)
Dollar-cost averaging is a strategy of investing a fixed amount of money at regular intervals (e.g. monthly or quarterly), regardless of market conditions. Instead of trying to time the market highs and lows, you invest routinely, which means you buy more shares when prices are low and fewer shares when prices are high. Over time, this can lower the average cost per share of your investments. The primary benefit of DCA is behavioral: it instills discipline and removes the temptation to make lump-sum timing decisions (which might be prone to error or emotion). For example, a retail investor might invest $500 on the first of every month into an S&P 500 index fund. In a down market, that $500 buys more shares (a good thing, since stocks are “on sale”), and in up markets, it buys fewer shares (preventing you from putting too much in at high valuations).
DCA is especially useful for investors who are regularly saving out of each paycheck, and it aligns with how many people invest through retirement plans (401(k) contributions each pay period, etc.). It also helps counteract loss aversion and anxiety: by spreading purchases over time, an investor is less likely to worry about putting a large sum in right before a downturn. Numerous studies have shown that while lump-sum investing (if you have a large sum available) can theoretically yield higher returns on average (because markets tend to go up over time, so investing earlier is usually better), the difference is not huge, and the risk of mistiming is high if one tries to be cute with market entry. Thus, for most retail investors, automated DCA into index funds is a sound approach. It turns investing into a habit and leverages the market’s long-term upward trajectory without the stress of short-term market guessing.
2. Index Fund Asset Allocation Models
Choosing to invest in index funds is step one; step two is deciding which indices and in what proportions to invest, a process known as asset allocation. A key insight from MPT is that the mix of assets (stocks, bonds, etc.) in your portfolio is a major determinant of your risk and return. Retail investors should tailor their allocation to their risk tolerance, time horizon, and financial goals.
Some common index fund allocation models include:
- Age-Based Stock/Bond Split: A traditional guideline is to hold a percentage of bonds roughly equal to your age (or age minus 10, etc.). For example, a 30-year-old might hold 70-80% in stock index funds (for growth) and 20-30% in bond index funds (for stability), whereas a 60-year-old might shift to ~40% stocks / 60% bonds to reduce volatility as retirement nears. This can be implemented with a Total U.S. Stock Market Index, a Total International Stock Index, and a Total Bond Market Index in proportions that suit the investor. Many fund companies offer target-date index funds that automatically adjust this mix as you age.
- Global Diversification: While the S&P 500 index covers U.S. large-cap stocks, a comprehensive passive strategy often includes international equities and small-cap equities for broader diversification. An allocation model could be, for instance: 50% U.S. stock index, 30% international stock index, 20% bond index. This captures a large swath of global market capitalization. Historically, the U.S. has performed well, but including international indices can provide exposure to different economic cycles and sometimes higher growth markets. It’s important to use low-cost index funds or ETFs for all these segments to maintain the fee advantage.
- Balanced Index Portfolio (e.g., 60/40): A classic balanced allocation is 60% stocks / 40% bonds. An investor could implement this with a single balanced index fund (some funds actually bundle indices to maintain a fixed 60/40 ratio). This approach smooths out some volatility compared to 100% stocks. Over the past century, a 60/40 portfolio has achieved a high fraction of the returns of an all-stock portfolio with substantially less volatility, making it a popular default for moderate risk investors.
- Three-Fund Portfolio: Popularized by the Bogleheads (followers of Jack Bogle’s philosophy), the three-fund portfolio typically consists of (1) a total U.S. stock index fund, (2) a total international stock index fund, and (3) a total U.S. bond index fund. With just these three, one can achieve broad diversification across virtually all publicly traded stocks in the world and a broad basket of investment-grade bonds. The exact percentages can be adjusted as desired (e.g., some might do 50% U.S. stocks, 20% international stocks, 30% bonds, etc.). This approach is simple, low-cost, and covers all bases. Despite its simplicity, it has historically outperformed the vast majority of complex, actively managed allocations.
The common thread in these models is diversification: by holding entire indexes, you eliminate idiosyncratic stock risk. You’ll never suffer from owning just the wrong stock at the wrong time – but you also won’t get rich from picking the next Amazon before it skyrockets. Instead, you reliably get the market’s return. Remember, the market’s return has been quite generous over the long run (U.S. stocks have averaged roughly 9-10% per year historically). By securing the market return at low cost, you put compounding to work in your favor. Active managers, by contrast, often end up inadvertently reducing diversification (for example, many active U.S. equity funds hold only 50-100 stocks, which is far less diversified than an index of 500 or 3,000 stocks), thus taking on additional unsystematic risk that isn’t compensated with higher expected return.
As an investor using index funds, once you set an allocation, it’s wise to rebalance periodically (say once a year or when allocations drift by a certain amount). Rebalancing means selling some of what’s gone up and buying what’s gone down to return to your target weights. This enforces a “buy low, sell high” discipline automatically. Many passive investors rebalance to maintain their risk level over time – and it has a side benefit of incrementally improving returns by not letting any one segment (like U.S. stocks after a strong run) become too overweight.
3. Tax-Loss Harvesting
For investors in taxable (non-retirement) accounts, tax-loss harvesting is a valuable strategy to enhance after-tax returns. This strategy involves selling investments that have declined below their purchase price to realize a taxable loss, and then (importantly) reinvesting the proceeds in a similar exposure so that your overall asset allocation remains the same. The realized capital loss can be used to offset capital gains on other investments, and up to $3,000 of ordinary income per year, thus reducing your tax bill. The freed-up tax savings can then be reinvested, boosting your portfolio’s growth.
How does this work in practice for a passive investor? Suppose you bought an international stock index fund, and after a market downturn it’s 15% below what you paid. You could sell the fund to harvest the loss. To maintain market exposure (avoiding the wash-sale rule, which disallows the loss if you buy back the same or “substantially identical” security within 30 days), you would immediately purchase a different fund or ETF that covers a similar asset class. For example, you might sell Vanguard’s Total International Stock Index Fund and buy iShares MSCI ACWI ex-US ETF – they are different funds but highly correlated in exposure. Now you have booked a capital loss which could save you, say, $1,000 in taxes, without materially changing your investment positioning. After 31 days, you could even switch back to the original fund if desired.
Over time, tax-loss harvesting can appreciably increase after-tax wealth. Especially during volatile periods, there are opportunities to harvest losses even as the market eventually recovers (the harvested losses remain to offset gains in the future). Many robo-advisors and wealth managers implement automated tax-loss harvesting for clients holding index portfolios. It’s essentially a way to let the tax code give you a small rebate for market downturns.
A related tax-efficient practice is to locate assets in the appropriate accounts (“asset location”). For instance, bond interest is taxed as ordinary income, so holding bond index funds in a tax-deferred account (like an IRA or 401k) can be advantageous, while stock index funds (which have mostly qualified dividends and capital gains) might sit in taxable accounts. Index funds are inherently tax-efficient because they have low turnover and typically don’t distribute large capital gains (the S&P 500 index rarely changes its constituents, and when it does, index funds can often use internal losses to offset gains). ETFs are even more tax-efficient due to their creation/redemption mechanism. The net effect is that index investing minimizes tax drag, and strategies like loss harvesting further that advantage. Active funds, conversely, tend to trade frequently (realizing taxable gains) and can deliver large unexpected tax bills to investors even in years when the fund lost money. This is another often-hidden cost where passive investing shines.
4. Factor-Based and Smart Beta Investing
While pure index investing means holding market-cap weighted indices, some investors may want to pursue slightly higher returns (or better risk characteristics) by tilting their portfolios toward known factors that have historically been associated with outperformance. This leads to factor-based investing, sometimes called “smart beta” when implemented via index-like rules.
Classic factors, identified in academic research (Fama-French and others), include: Size (small-cap stocks tend to outperform large-caps in the long run, albeit with more volatility), Value (stocks that are cheap relative to fundamentals tend to outperform growth stocks with high valuations over long periods), Momentum (stocks that have outperformed in the recent past often continue to outperform in the short term), Quality or Profitability, and others like Low Volatility. These factor premiums have economic or behavioral rationales: e.g., value stocks may carry a risk premium or benefit from mean reversion; momentum may exist due to investors underreacting then overreacting.
A retail investor can access factors through index-based ETFs or funds that track factor indexes. For example, one might allocate a portion of equity holdings to a small-cap value index fund to get exposure to both the size and value factors, which historically delivered higher returns than the broad market (with some years of underperformance in between). Another example is using a quality dividend index that tilts toward companies with strong balance sheets and dividends, aiming for a slightly different risk/return profile than the broad market. These strategies are still passive in the sense that they follow mechanical index rules (no discretionary stock picking by a manager), but they are active in the sense of deviating from the market-cap weighted portfolio.
It’s important for investors to have realistic expectations with factor investing. While factors have earned premiums historically (for example, small-cap and value stocks outperformed large-cap growth over many decades in a number of markets), there is no guarantee they will always do so. There can be prolonged periods (even a decade or more) where a factor underperforms the broad market – a recent example being the underperformance of value stocks in the 2010s bull market, followed by a resurgence in 2021–2022. Therefore, factor tilts should be done in moderation and with patience; one must stick with them through cycles to potentially reap the rewards. They also usually come with slightly higher expense ratios (though many factor ETFs are still quite cheap, on the order of 0.1% – 0.3% annually).
For those who want to keep it very simple, factor investing is not required – a plain market index fund already puts you ahead of most. But for a modest complexity increase, factor tilts offer a way to potentially outperform the market by a small margin in the long run, without resorting to stock picking. Think of it as choosing which slice of the market to overweight. Academic studies (and real-world results like DFA funds) have shown that disciplined exposure to value, size, etc., can add value over time (though again, with periods of drought).
5. Other Best Practices
Beyond the four strategies above, a few additional points round out a solid passive investment approach:
- Keep Costs Low: This cannot be stressed enough. The expense ratio of index funds and ETFs is a crucial advantage. Many broad market ETFs have expense ratios under 0.05% per year now. There is essentially no reason for a retail investor to pay 1%+ to a mutual fund manager in the hopes they beat the index – the data says they likely won’t, and that 1% fee alone can consume a large chunk of your returns over time. Also be mindful of transaction fees and bid-ask spreads; using commission-free brokers and sticking to highly liquid index funds avoids these frictions.
- Stay the Course (Discipline): One of the hardest parts of investing is not reacting emotionally to market swings. A passive investor must remember that the strategy works over time but does not mean you won’t see losses in the short run. A broad index can drop 30% in a bad year (as it did in 2008 or early 2020), but historically it has always recovered and hit new highs. The virtue of passive investing is that you never have to guess when to get out or in – you stay invested. The investor’s job is mainly to set the right asset allocation (so that you can endure the downturns) and then remain disciplined. An oft-cited quote is “Time in the market beats timing the market.” By staying fully invested in an index strategy, you ensure you participate when the big rebounds and bull runs occur (which an active market-timer might miss by being on the sidelines). As evidence of how difficult timing is, consider that a significant portion of stock market gains come from just a handful of the best days, which are almost impossible to predict. Missing those best days by being out of the market can drastically lower returns. A passive strategy coupled with discipline avoids that pitfall.
- Rebalance and Review: While passive portfolios don’t require constant attention, they aren’t entirely “set and forget.” Life circumstances change – for example, as one approaches retirement, reducing equity exposure might be prudent (to lower volatility). So revisit your asset allocation as needed (but not too frequently – annually or after major life events is fine). Rebalancing, as mentioned, keeps your risk in check and can systematically buy low/sell high. Just be careful about tax implications of rebalancing in taxable accounts (use new contributions or do it within IRAs when possible).
- Use Tax-Advantaged Accounts: Whenever possible, do your investing through tax-advantaged accounts like 401(k)s, IRAs, or Roth IRAs. These accounts either defer taxes or eliminate future taxes on gains, which pairs extremely well with index investing. In a tax-deferred account, you don’t need to worry about capital gains distributions at all – you can even rebalance freely. In Roth accounts, all growth is tax-free. By maximizing contributions to these accounts, you can let the index funds compound without drag, and then complement with taxable account investing if needed (using tax-loss harvesting as discussed).
By following these strategies, retail investors can construct a portfolio that is robust, low-maintenance, and positioned to earn the market’s returns with minimal leakage. Such a portfolio, over the long run, will likely beat the vast majority of actively managed alternatives, as the data shows. It’s telling that even many large institutional investors (pensions, endowments) have been shifting to index-based strategies for broad asset classes – the logic that worked for John Bogle’s individual clients in the 1970s holds just as true for billion-dollar funds today.
Conclusion
Decades of financial research and real-world outcomes converge on a clear conclusion: beating the market is hard, and doing so consistently over long periods is exceedingly rare. The so-called 90% rule – that roughly 90% of professional managers underperform their benchmark – encapsulates this reality. We explored why this is the case, from the perspective of efficient markets (information already in prices), cost structures (active fees and trading erode returns), and behavioral pitfalls (which can lead even smart managers astray). The evidence, spanning over half a century and numerous markets, overwhelmingly favors a passive, index-centric approach for investors who want reliable results.
For retail investors, the implications are empowering. You do not need to pay high fees or find a “star” fund manager to achieve your financial goals. In fact, your odds improve if you avoid those trappings. By embracing passive investment strategies – using low-cost index funds, diversifying broadly, investing consistently (dollar-cost averaging), and paying attention to tax efficiency – you position yourself to capture the full power of market returns. Those returns, compounding over years and decades, can be quite powerful, as the growth of index fund assets and the success stories of disciplined investors attest. Meanwhile, the typical actively managed fund not only charges more, but often delivers less.
It’s important to acknowledge that active management isn’t “bad” per se – active traders provide liquidity and help price discovery in the markets, and a select few will outperform. However, as an investment proposition for individuals, active funds are a statistically losing bet. As we’ve shown, even professionals armed with information and technology are mostly unable to outwit the collective market in the long run. The efficient market hypothesis provides one reason: when so many participants compete, prices generally reflect fair value quickly. Modern Portfolio Theory adds that just holding the market can be optimal for risk-adjusted returns. And our look at behavioral factors reminds us that humans are not wired to be perfect traders – emotions and biases can lead to systematic mistakes.
Passive investing, while sometimes criticized as “settling for average,” in practice turns out to deliver above-average results when average is measured against the universe of actively managed outcomes. In an ironic twist, being content with matching the market actually puts you in the top echelon of performance over time, because so many others will falter in their attempts to do better. As the legendary investor Warren Buffett has said, for most investors the smartest thing is to “own a cross-section of businesses (via an index fund) and sit for an extended period,” rather than trying to find the next big winner.
In closing, the takeaways from this whitepaper are:
- The 90% rule is real: Consistent underperformance by active funds is documented and persistent. Over long horizons, a vast majority of professionals don’t beat simple index benchmarks, especially after costs.
- Theory and data agree: Market efficiency and cost math explain why this happens.
- Passive investing works: A retail investor can harness market returns with minimal drag and drama through index funds. By diversifying and staying disciplined, one can avoid the pitfalls that hurt active managers.
- Enhancements are available: Strategies like DCA, asset allocation, tax-loss harvesting, and factor tilts can improve the investor’s experience and outcomes, all while remaining true to the passive philosophy of not picking individual stocks or timing markets.
- Keep learning and stay the course: Investing is a long journey. While the concepts here are powerful, they require patience and consistency to bear fruit. The simplicity of a passive strategy is actually one of its great strengths – it’s easier to stick with through rough markets when you have a clear, rules-based plan.
Ultimately, “beating the market” may be a seductive goal, but as this analysis shows, the pursuit often leaves one worse off. By flipping the script and aiming simply to be the market, investors can tilt the odds overwhelmingly in their favor. The 90% rule doesn’t have to be a disappointment; for the savvy retail investor, it’s an invitation to join the winning side – the side that doesn’t try to beat the index, but rather buys the index and lets market capitalism do the heavy lifting. In investing, as in many domains, sometimes the simplest solution is the most powerful one.